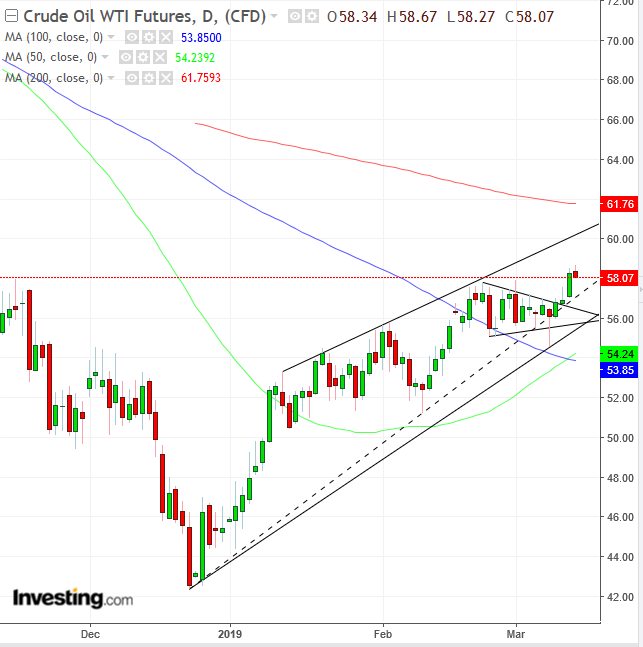
Oil prices rose 2.4% yesterday after data showed U.S. crude inventories fell. The price is sliding today, as a mix of issues tug prices back and forth. However, we believe the medium and long-term trends remain positive despite periodical short-term dips.
Disruptive events like Venezuela’s blackout barring its production from global supply and OPEC+ maintaining aggressive cuts at least till the next meeting in June, are putting supply under increasing pressure. At the same time, demand is expected to rise as recent positive data on the U.S. economy emerges, with wages growing 3.4% to a 10-year high, and U.S. business equipment orders climbed the most in six months.
Oil's technicals confirm and support this bullish thesis.

Yesterday’s crude price broke the topside of a pennant, a converging trading range. The presumptive dynamic that dominates the pattern is of a bulls’ changing of the guard. Traders who enjoyed the sharp-13% surge within the eight sessions between Feb. 11 and Feb. 21 are catching their breath as they question the viability of the strong rally and wait for the market’s next move.
The old guard cashing out is thought to be the supply, while the demand occurs via the next-generation bulls, who missed the first rally but are charging ahead of what they expect to be a second rally, after the trend paused since Feb. 21.
The upside breakout yesterday signaled to the old guard that they weren’t wrong after all, and they returned in force, pushing prices higher. Bears found themselves in a short squeeze, driving them to buy contracts to return to their brokers, thereby increasing demand, going against their own positions. Finally, any undecided traders jump in for the ride up.
While we do not know whether this is necessarily the case now, that is the presumptive scenario, based on the pattern, within the context of the market. We consider other evidence to support the textbook dynamic of the pennant formation.
First: this formed-on top of the February peak. That’s a clue. It suggests another layer of the dynamic, a tug of war—or simply a process of unraveling positions—as the former resistance of supply turns to support of demand.
Second: the formation developed as the price fell to the uptrend line since the late-December bottom. That level also provides the impetus for a conflict for the price, between resuming the fall from under $58 on Feb. 22 or bouncing off the rising demand line of the short-term uptrend.
Third: the pattern emerged after crossing, and on top of, the 100 DMA, another supply-demand crossing point.
Fourth: the pennant came together as the 50 DMA was approaching the 100 DMA, demonstrating the potential next catalyst. Indeed, the upside breakout pulled the 50 DMA over the 100 DMA, triggering yet another bullish indicator.
Finally, the pennant formed below the 200 DMA, a milepost always gaining the spotlight, among non-technicians as well. Bulls are gearing up to cross over, and bears are preparing to short.
All the above merges into one picture, underlying the presumptive hidden scene beneath the surface, with all its explosive force. For now, the upside breakout demonstrates that bulls are in charge, though look out for the likely return move, as the market retests this view.
Trading Strategies
Conservative traders should wait for the price to correct back toward the pennant, which will demonstrate its support, with at least one long, green candle engulfing a red or small candle of either color.
Moderate traders may wait for the return move for a better entry but not necessarily for proof of trend.
Long Trade Sample
- Entry: $57
- Stop-Loss: $56
- Risk: $1
- Target: $60, round psychological number
- Reward: $3
- Risk-Reward Ratio: 1:3
Aggressive traders may risk a contrarian short position, counting on the expected return move, provided they understand the risk.
Short Trade Sample
- Entry: $58.50
- Stop-Loss: $58.75
- Risk: $0.25
- Target: $57, above closing prices March 4-12
- Reward: $1.5
- Risk-Reward Ratio: 1:6
