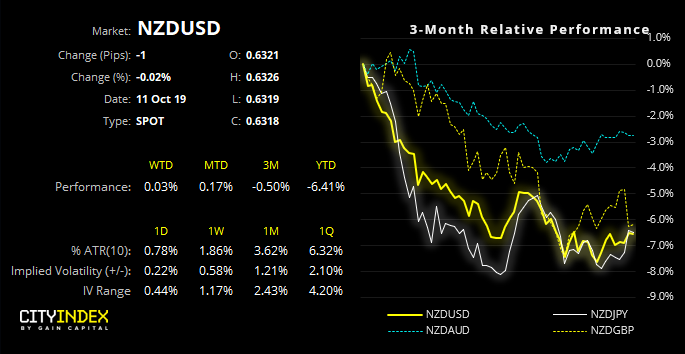
Optimism surrounding trade talks and Brexit has weighed on the dollar, providing a reprieve for some arguably oversold commodity currencies.
As noted by my colleague Fawad Razaqzada, AUD/USD is on the cusp of printing a bullish hammer on the weekly chart, helped by improved trade sentiment and less demand for the US dollar. However, it’s also had a positive effect on commodity currencies NZD and CAD, with the Kiwi dollar close to confirming a bullish reversal pattern, despite printing weak electronic retail sales and a third month of contracting manufacturing PMI. Of course, if data is to improve alongside US-China trade relations, we’d expect further upside. Whilst we remain hesitant to suggest a trade deal is close, we see the potential reversal on NZD/USD as a corrective move as opposed t a full trend reversal. 
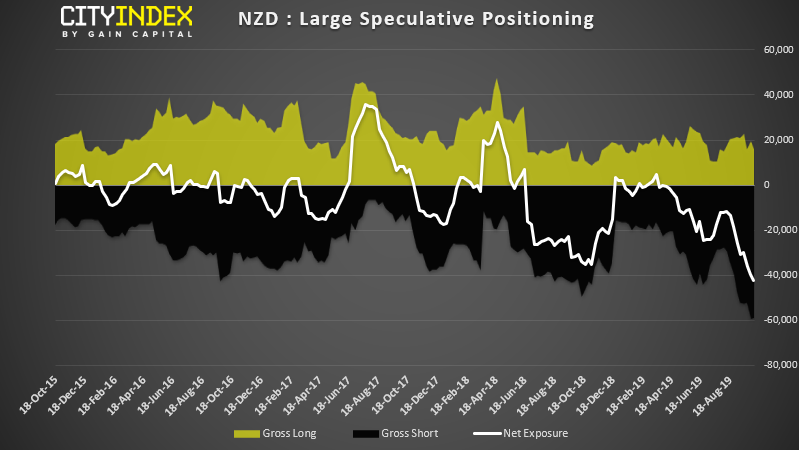
On the 30th of September we noted the potential for a reversal on NZD/USD, due to extreme market positioning. “NZD is at high risk of a sentiment extreme so could be vulnerable to a bullish rally if economic data allows. With many kiwi crosses looking overstretched to the downside, we’ll be keeping a close eye on the potential for bases to form”. With gross-short ant net-short poisoning sat at fresh record highs and the 3-year Z-score at -3.8, the odds of bearish capitulation has only increased. So we’re watching price action very closely as it could be on the cusp of confirming a bullish reversal pattern.

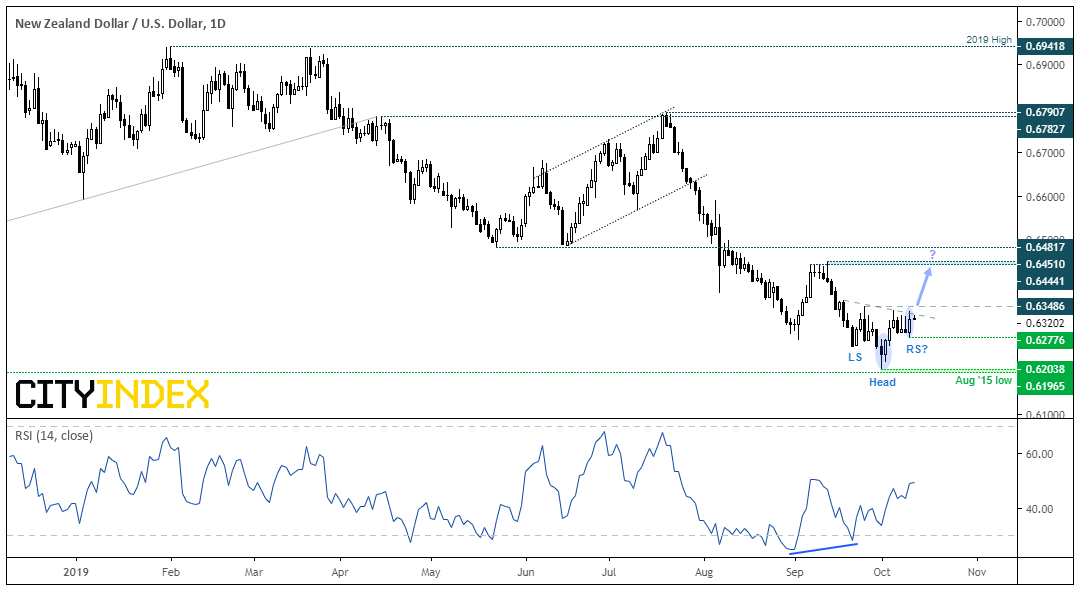
On the 1st of October, NZD/USD found itself at a 4-year low. Yet it’s failure to test the August 2015 low produced a spinning top doji just above key support, and the subsequent bullish engulfing candle provided a two-bear reversal pattern. Not only did this coincide with a bullish divergence with the RSI, but the -bar reversal pattern could be the ‘head’ of an inverted head and shoulders pattern. Yesterday’s bullish engulfing candle suggests the right shoulder (RS) is being formed so, if we’re to see a break above the neckline, we’d assume the bullish reversal pattern to be confirmed.
- A break above the neckline confirms an inverted head and shoulders pattern which, if successful, projects an initial target around 0.6450.
- Traders may want to wait for a break of 0.6350 for extra confirmation of a breakout.
- A minor break below 0.6277 (RS) doesn’t necessarily invalidate the potential pattern, but we could use a volatile break beneath it to step aside or reconsider bearish setups in line with the dominant trend.
- The daily trade remains bearish below 0.6451, so the inverted head and shoulders pattern is assumed to be part of a correction as opposed to trend reversal for now,
"Disclaimer: The information and opinions in this report are for general information use only and are not intended as an offer or solicitation with respect to the purchase or sale of any currency or CFD contract. All opinions and information contained in this report are subject to change without notice. This report has been prepared without regard to the specific investment objectives, financial situation and needs of any particular recipient.
Any references to historical price movements or levels is informational based on our analysis and we do not represent or warrant that any such movements or levels are likely to reoccur in the future. While the information contained herein was obtained from sources believed to be reliable, the author does not guarantee its accuracy or completeness, nor does the author assume any liability for any direct, indirect or consequential loss that may result from the reliance by any person upon any such information or opinions."
