Commodities: Market Structure Provides Price Direction Clues
Andy Hecht | May 28, 2021 18:48
This article was written exclusively for Investing.com
- The commodity price cycle
- Term structure
- Location and quality spreads
- Processing spreads
- Substitution spreads
I have been trading commodities since the very early 1980s, when I began my career at Philipp Brothers, which came Salomon Brothers, and then Citigroup. In the 1970s and 1980s, Philipp Brothers was the leading raw material merchant with offices worldwide. Where the company did not have a formal office, it had agents. After working for the company during my high school and college years, I decided to forego law school to take a job in the telex room. In the early 1980s, Philipp Brothers continued to groom the next generation through a lehrling program. Lehrling is German for an apprentice.
After delivering telex messages to the traffic and trading departments, which was an education in the commodities the firm handled, I moved to the traffic department. I executed trades by shipping and arranging operational logistics for the items bought and sold by the firm. After a few years, I moved into the trading area, where I rose to run several commodity businesses for the company in the 1990s.
The education at Philipp Brothers comprised everything from physical commodity trading to derivatives. I learned that each commodity had distinctive characteristics and that market structure is a critical part of fundamental analysis that provides clues about the path of least resistance of prices.
Technical analysis is a critical part of my overall market calculus as it is a sentiment barometer that pushes prices higher or lower. Fundamental analysis can reveal stages of a pricing cycle that create a surplus or deficit conditions in raw material markets.
The commodity price cycle
Raw materials experience price cycles. They tend to decline to levels where production falls, inventories drop, and demand rises, creating bottoms. During bull markets, prices move to levels where producers increase output, inventories begin to build, and demand drops, creating tops. Commodities are volatile assets. Prices can rise or fall to illogical, unreasonable, and even irrational levels at tops or bottoms. Two examples are the cotton market in 2011 and the crude oil market in 2020.
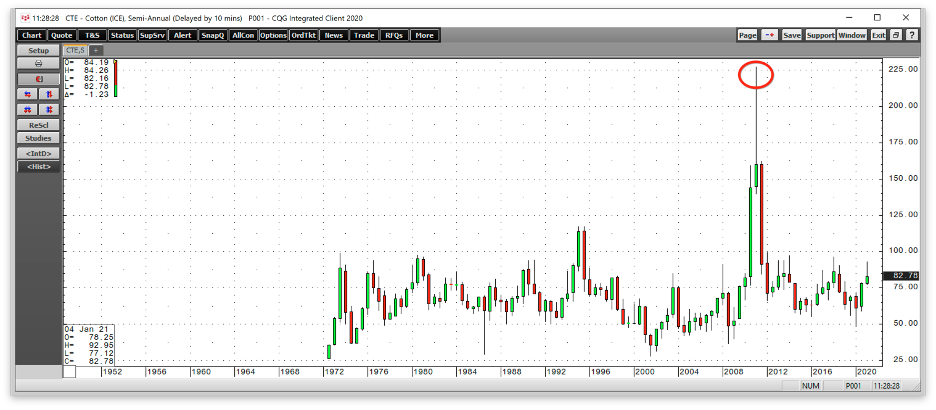
Source: CQG
The semiannual cotton chart highlights the price spike to $2.27 per pound. ICE cotton futures had never traded over $1.1720 before or after the 2011 peak.
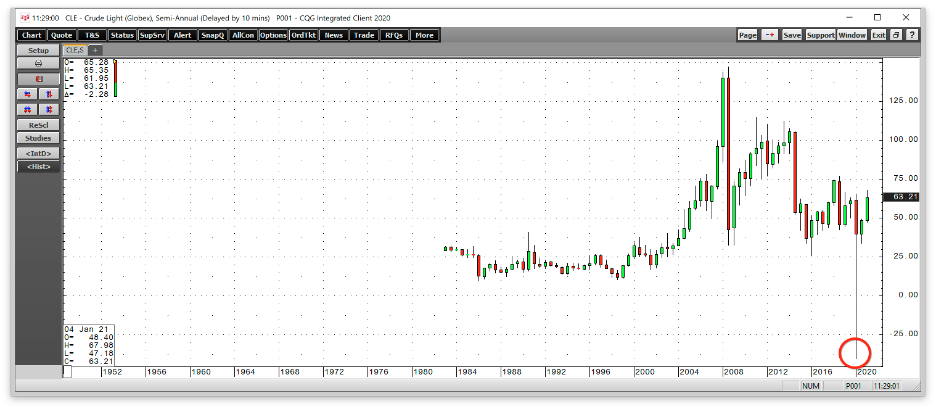
Source: CQG
The semiannual NYMEX crude oil chart displays the downside spike to negative $40.32 per barrel as demand evaporated during the global pandemic and storage capacity disappeared on Apr. 20, 2020, as the nearby NYMEX contract was in the delivery period. NYMEX crude oil futures had not traded below $10.35 per barrel before or after the bearish spike.
The commodity price cycle created a top in cotton in 2011 and a bottom in crude oil in 2020.
Term structure
One of the leading indicators of supply and demand in a commodities futures or forward market is term structure. Backwardation is a condition where nearby prices are higher than prices for deferred delivery. A backwardated market reflects a nearby shortage of supplies. The anticipation of increasing production causes lower prices for deferred delivery
Source: Barchart
The chart shows that soybeans for July delivery were trading at the $15.4075 per bushel level with new crop November beans at $13.6550, a $1.7525 or 11.4% backwardation. The shortage of nearby soybeans is because of robust Chinese demand. The lower price for November delivery reflects optimism that the 2021 crop will satisfy demand.
Contango is a condition where deferred prices are higher than nearby prices. Contango reflects plenty of nearby supplies when a market is in a glut or when supply and demand reach equilibrium.
Source: Barchart
The chart highlights that gold for delivery in April 2022 is trading at $9.50 higher than gold futures for delivery in June 2021. Central banks hold around 30% of all of the gold ever mined in the world’s history. Without concerns about supplies, markets tend to trade in contango.
Contango and backwardation tell us if markets are tight, or if demand outstrips supplies, or if they are loose when supplies are equal to or greater than nearby demand.
Location and quality spreads
A quality spread reflects the price differential between two grades of the same commodity. A location spread is the price difference for the same commodity in two different areas of the world. An example of a combination of a location and quality spread is the differential between Brent and West Texas Intermediate crude oil, the two pricing benchmarks for the energy commodity.
Brent crude oil trades in the futures market on the Intercontinental Exchange. Brent crude oil is the pricing mechanism for crude oil produced in Europe, North Africa, and the Middle East. The Middle East is home to over half the world’s crude oil reserves. Brent has a higher sulfur content than WTI crude oil, making it preferable for refining into distillate products, including heating oil, jet, and diesel fuels.
West Texas Intermediate trades on the CME’s NYMEX division. WTI comes from North America and has a lower sulfur content, making it the crude oil of choice for gasoline refineries.
Approximately two-thirds of the world’s consumers and producers use the Brent benchmark for pricing, while one-third of pricing uses WTI. The difference in composition and production locales makes the differential between Brent and WTI a location and a quality spread.
Source: Barchart
The chart shows the recent price of $66.62 for July Brent crude oil futures.
Source: Barchart
Meanwhile, NYMEX WTI futures for July delivery were trading at $63.24 per barrel at the same time. Brent commanded a $3.38 premium to WTI, reflecting the supply and demand for the different locations and qualities of the energy commodity. Moreover, Brent-WTI is also a political risk spread as the Middle East is the world’s most turbulent political region.
Quality and location spreads can tell us about market fundamentals worldwide. Over the past decade, Brent’s premium over WTI tends to rise when crude oil prices are moving higher. However, that could change over the coming years as increased regulations and lower fossil fuel output under the Biden administration to address climate change may change the dynamics and historical trading pattern of the Brent-WTI location and quality spread.
Processing spreads
Processing spreads reflect the price margin for refining, crushing, or processing one traded commodity into another. The margin or processing of crude oil into gasoline and distillate products or “crack spreads” are an example of processing spreads. Crude oil is processed via a catalytic cracker in oil refineries. When the refining margin rises, it offers clues that demand for oil products is increasing, which often translates to higher prices for the input, crude oil.
The margin for processing raw soybeans into soybean products, soybean meal, and soybean oil is called the crush spread. Crushing soybeans creates the meal and oil products.
Source: Barchart
The chart of the July soybean crush spread can serve as a guide that provides price clues for soybean futures. A rising crush spread tells us that the demand for meal and oil is rising, while a falling crude signifies the opposite, which spotlights the level of demand for the underlying oilseeds and the potential for the path of least resistance of prices.
Processing spreads are a part of a commodity market’s structure that can be valuable for fundamental analysts making price forecasts.
Substitution spreads
A substitution spread tells us the historical price differential between two commodities that can be production or consumption substitutes. Each year, during the planting season, many US farmers have a choice of planting corn or soybeans on their acreage. The price differential between new crop prices can dictate if they plant beans or corn. The long-term average of the spread is at around 2.4 bushels of corn value in each bushel of soybean value. Farmers use the new crop-post harvest futures prices to determine the ratio.
Source: Barchart
Most recently, new crop November 2021 soybean futures were trading at the $13.6650 per bushel.
Source: Barchart
At the same time, new crop December 2021 corn futures were at the $5.2900 per bushel level. The ratio is calculated by dividing soybean by corn prices, yielding a 2.58:1 ratio. At above the long-term 2.4:1 average, farmers are likely to plant more corn than beans at the level of the spread as the beans offer a more attractive financial result.
The corn-bean ratio is an example of a substitution spread from the producer’s point of view. An example for the consumer is the spread between platinum and gold. For many years, platinum traded at a premium to gold, earning it the nickname “rich person’s gold.” Since 2014, platinum’s price slipped below gold and continued to fall. As of May 19, nearby NYMEX platinum futures were at the $1202 level, with gold at $1885. At a $683 discount, platinum is historically inexpensive compared to the gold price. Investors who purchase precious metals as a store of value may opt for platinum given its historically low price compared to gold.
Corn versus soybeans or platinum versus gold is just two examples of many for substitution spreads in the commodities asset class. Historical price deviations can create excess supply or demand in two commodities that result in mean reversion towards historical averages.
Market structure is like a jigsaw puzzle in the world of commodities. Putting the various pieces together can give investors and traders an edge in projecting the path of least resistance.
Trading in financial instruments and/or cryptocurrencies involves high risks including the risk of losing some, or all, of your investment amount, and may not be suitable for all investors. Prices of cryptocurrencies are extremely volatile and may be affected by external factors such as financial, regulatory or political events. Trading on margin increases the financial risks.
Before deciding to trade in financial instrument or cryptocurrencies you should be fully informed of the risks and costs associated with trading the financial markets, carefully consider your investment objectives, level of experience, and risk appetite, and seek professional advice where needed.
Fusion Media would like to remind you that the data contained in this website is not necessarily real-time nor accurate. The data and prices on the website are not necessarily provided by any market or exchange, but may be provided by market makers, and so prices may not be accurate and may differ from the actual price at any given market, meaning prices are indicative and not appropriate for trading purposes. Fusion Media and any provider of the data contained in this website will not accept liability for any loss or damage as a result of your trading, or your reliance on the information contained within this website.
It is prohibited to use, store, reproduce, display, modify, transmit or distribute the data contained in this website without the explicit prior written permission of Fusion Media and/or the data provider. All intellectual property rights are reserved by the providers and/or the exchange providing the data contained in this website.
Fusion Media may be compensated by the advertisers that appear on the website, based on your interaction with the advertisements or advertisers.