How Patience and Delayed Gratification Can Fuel Long-Term Gains
Investing.com | Nov 09, 2023 23:12
- The Marshmallow Test was designed to assess children's self-control and ability to delay gratification
- But that is a test today's investors have failed miserably, with short-term returns favored over long-term
- The financial markets are like the marshmallow test: if you delay gratification, your investments will flourish
Have you ever heard of the Marshmallow Test?
Initially designed for a juvenile audience, the test made its debut at Stanford University in the 1980s with a fundamental objective: gauging a child's ability to exercise self-control by delaying immediate gratification for a more significant reward in the future.
The mechanics of the test were straightforward—children were presented with a choice: consume a single marshmallow immediately or wait for 15 minutes to receive two. Those opting for instant consumption could ring a bell before the 15-minute mark, forfeiting the second marshmallow.
Remarkably, the outcomes over time revealed that children exhibiting patience and forgoing short-term gains in favor of delayed rewards tended to achieve better college results and develop higher self-esteem.
How Is This Test Relevant for Today's Investors?
Applying the Marshmallow Test to the financial markets, one wonders: how would investors fare in a similar scenario? Unfortunately, many investors resemble the child who opts for immediate consumption, sacrificing potential long-term benefits. This analogy prompts reflection on how frequently investors, lured by short-term gains, compromise the substantial returns offered by the stock market.
Consider the instances where investors buy stocks, only to sell within 3-6 months, neglecting the merits of an 8-10 year investment horizon. Such behavior undermines individual performance relative to the market and hinders the capture of the full spectrum of opportunities presented by various asset classes.
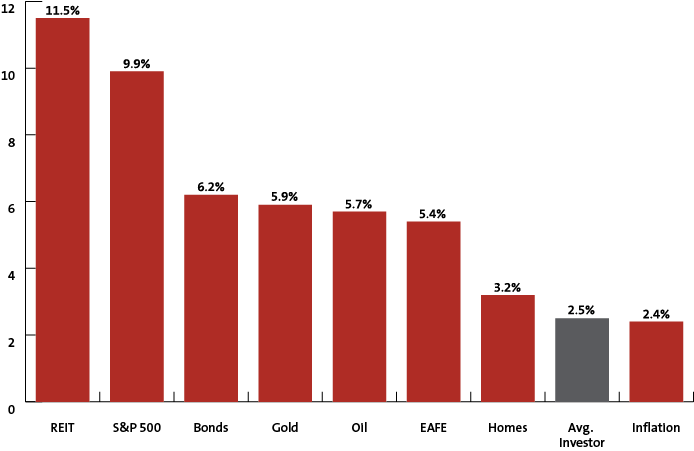
The ensuing illustration depicts the stark contrast between market offerings (depicted in red columns) and the average investor's returns over a 20-year period (depicted in gray).

The rush of today's world has fueled our desire for instant gratification, mirroring those kids who can't resist devouring the marshmallow immediately, forsaking the promise of two later. As the market rollercoaster unfolds, investors, driven by a six-month horizon, are on edge, influenced by the current ebb and flow seen in 2022 and 2023.
The pivotal query for investors: Can they resist the allure of short-term gains (or losses) to secure more substantial rewards in the long run?
No academic scores here, but the contrast will be crystal clear over a decade or two. The patient and self-disciplined, akin to the second group of marshmallow testers, will watch their investments flourish, while the impulsive hunger of the first group will persist.
***
Disclaimer: This article is written for informational purposes only; it does not constitute a solicitation, offer, advice, counsel or recommendation to invest as such it is not intended to incentivize the purchase of assets in any way. I would like to remind you that any type of asset, is evaluated from multiple points of view and is highly risky and therefore, any investment decision and the associated risk remains with the investor.
Trading in financial instruments and/or cryptocurrencies involves high risks including the risk of losing some, or all, of your investment amount, and may not be suitable for all investors. Prices of cryptocurrencies are extremely volatile and may be affected by external factors such as financial, regulatory or political events. Trading on margin increases the financial risks.
Before deciding to trade in financial instrument or cryptocurrencies you should be fully informed of the risks and costs associated with trading the financial markets, carefully consider your investment objectives, level of experience, and risk appetite, and seek professional advice where needed.
Fusion Media would like to remind you that the data contained in this website is not necessarily real-time nor accurate. The data and prices on the website are not necessarily provided by any market or exchange, but may be provided by market makers, and so prices may not be accurate and may differ from the actual price at any given market, meaning prices are indicative and not appropriate for trading purposes. Fusion Media and any provider of the data contained in this website will not accept liability for any loss or damage as a result of your trading, or your reliance on the information contained within this website.
It is prohibited to use, store, reproduce, display, modify, transmit or distribute the data contained in this website without the explicit prior written permission of Fusion Media and/or the data provider. All intellectual property rights are reserved by the providers and/or the exchange providing the data contained in this website.
Fusion Media may be compensated by the advertisers that appear on the website, based on your interaction with the advertisements or advertisers.