The Goings-On With Gasoline Futures
Mike Zaccardi, CFA, CMT | Jul 05, 2022 19:36
This article was written exclusively for Investing.com
- Retail traders can play movement in gasoline futures through the UGA ETF
- After hitting an all-time high in June, RBOB futures have declined to support
- Bearish seasonal trends often take hold during Q3
As travelers return from their July 4 excursions, the pain at the pump is no doubt sharp. The average price of a gallon of regular unleaded was a smidge under $5 over the holiday weekend—barely off the all-time high notched last month, according to data from American Automobile Association. Did you know there is a way for retail traders to play moves in gasoline futures without having to open a risky futures trading account?
The United States Gasoline Fund (NYSE:UGA) is a solid proxy for what’s happening with wholesale gas prices. The ETF actually does a much better job tracking its underlying commodity compared with, say, the popular oil ETF—the United States Oil ETF (NYSE:USO). According to USCF, the company issuing UGA shares, UGA tracks in percentage terms the movements in RBOB gasoline futures prices. It primarily holds near-dated contracts. Interestingly, the national average pump price is usually about 90 cents above the spot RBOB price.
What I really like about UGA is how tightly it tracks RBOB. Close returns are not always seen when trading commodity-based ETFs. The performance chart below illustrates that UGA is a terrific proxy for owning gasoline futures. You might wonder why UGA beats RBOB over the last decade. The reason is that commodity ETFs face roll risk—that is the monthly process whereby the fund company must sell contracts about to expire, then buy a later-dated contract. When the commodity is in backwardation—a situation in which near-dated months trade at a premium to outgoing contracts—then the commodity benefits from positive roll yield. The opposite is called “contango”, and is a cost. RBOB rarely faces major contango situations.
UGA And Gasoline Futures: Very Close Performance Relationship Over The Past 10 Years
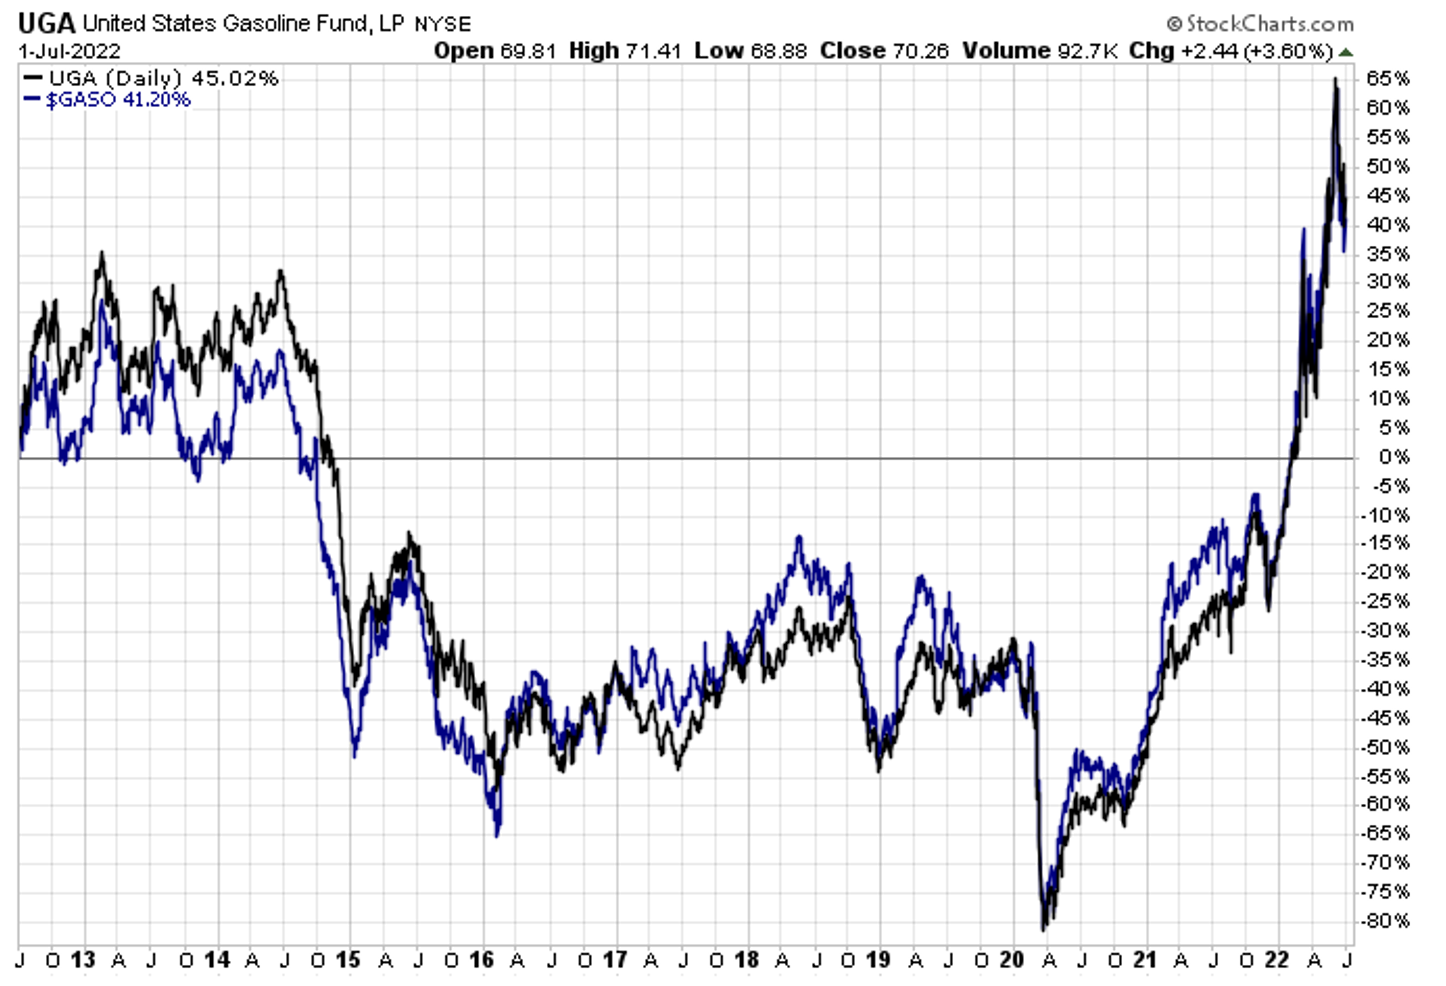
Source: Stockcharts.com
So where do the charts suggest gasoline prices are headed?
I like to refer to the continuous prompt-month of RBOB futures for a technical reading. The chart below dates back to the mid-2000s. Notice how the prior all-time high was notched about this time in 2008 above $3.60. RBOB never climbed above that level during rallies from 2011 through 2013. So, $3.34 to $3.63 should be support as RBOB futures ease back down—but a break below that range could trigger a move to the next support point near $2.45. You can play UGA according to these RBOB futures levels.
RBOB Gasoline Futures Since Mid-2000s: Support At Prior Highs And $2.45
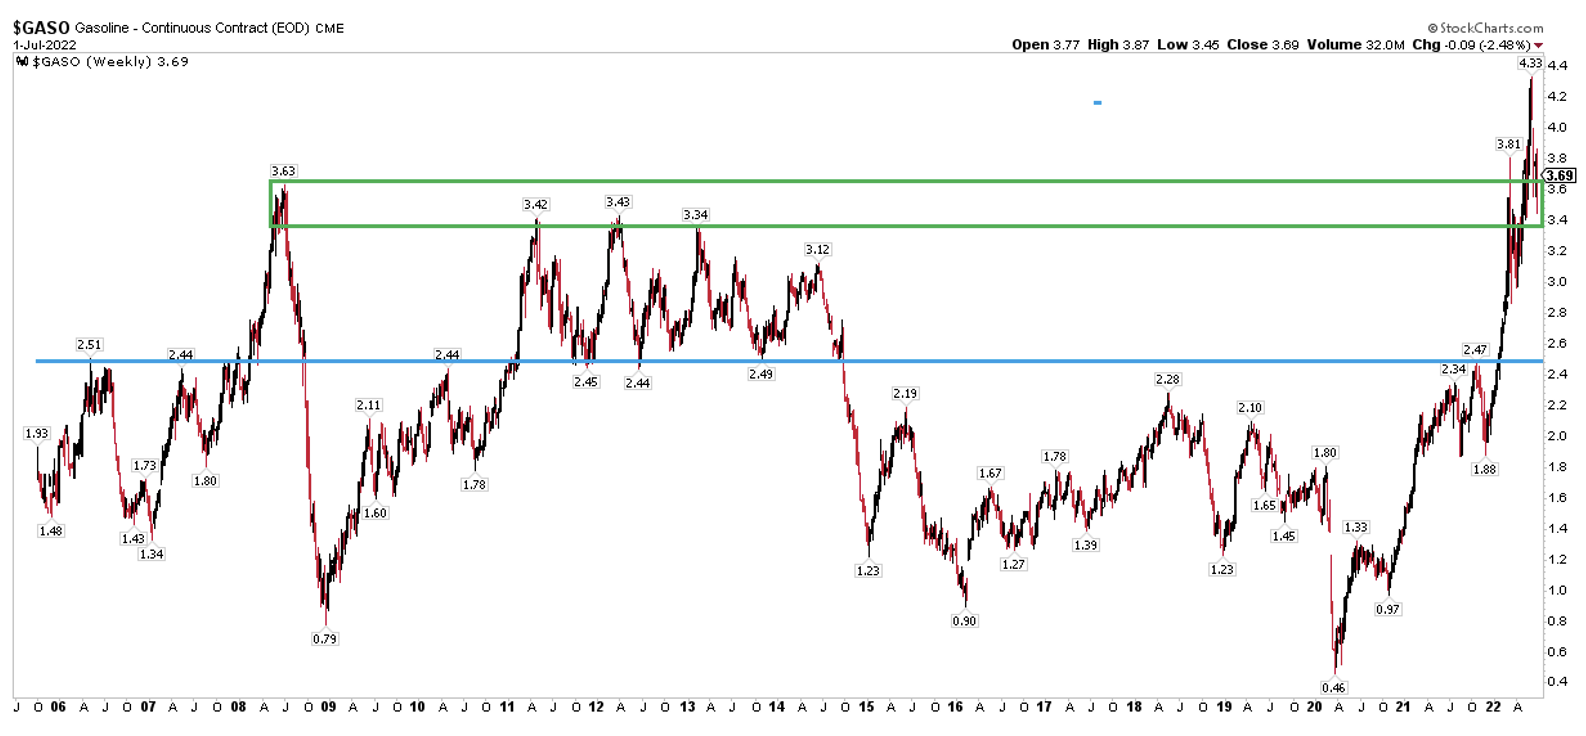
Source: Stockcharts.com
Another factor to consider is seasonality. According to EquityClock.com, RBOB tops out this time of year. The second half of the calendar year often features strong downside price action, so if we see the technical chart breakdown, there’s a solid bearish case to be made.
An 'Average Year' For RBOB Gasoline Futures: A Bearish H2 On The Way?
Source: EquityClock
Bottom Line
While you might be a lot lighter in your pocketbook after traveling for the long holiday weekend, keep your eye on the chart of RBOB gasoline as it rests at an important support zone. A break lower could trigger a significant drop during the second half of 2022.
Trading in financial instruments and/or cryptocurrencies involves high risks including the risk of losing some, or all, of your investment amount, and may not be suitable for all investors. Prices of cryptocurrencies are extremely volatile and may be affected by external factors such as financial, regulatory or political events. Trading on margin increases the financial risks.
Before deciding to trade in financial instrument or cryptocurrencies you should be fully informed of the risks and costs associated with trading the financial markets, carefully consider your investment objectives, level of experience, and risk appetite, and seek professional advice where needed.
Fusion Media would like to remind you that the data contained in this website is not necessarily real-time nor accurate. The data and prices on the website are not necessarily provided by any market or exchange, but may be provided by market makers, and so prices may not be accurate and may differ from the actual price at any given market, meaning prices are indicative and not appropriate for trading purposes. Fusion Media and any provider of the data contained in this website will not accept liability for any loss or damage as a result of your trading, or your reliance on the information contained within this website.
It is prohibited to use, store, reproduce, display, modify, transmit or distribute the data contained in this website without the explicit prior written permission of Fusion Media and/or the data provider. All intellectual property rights are reserved by the providers and/or the exchange providing the data contained in this website.
Fusion Media may be compensated by the advertisers that appear on the website, based on your interaction with the advertisements or advertisers.