The Week Ahead: Volatility Abounds As Traders Unwind Fed's Pivot Trade
Pinchas Cohen | Aug 29, 2022 00:05
- Nonfarm payrolls become especially significant given Fed's data dependence.
- The Fed is basing economic strength on employment.
- Detailed technical breakdown of downtrend.
Stocks have the technical potential to be the most volatile in months as investors have repriced rate expectations to coincide with trend synchronization.
Federal Reserve Chair Jerome Powell served at Jackson Hole an ice-cold glass of reality to investors operating on the foregone conclusion that a bear rally is a bottom, as they argued that the Fed pivoted. Anyone following Fed messages in general, and Powell's in particular, would have noticed that the chief took great pains to be as straightforward as possible: rates will remain elevated for the foreseeable future. Powell also reiterated that the central bank would be data-dependent instead of providing guidance.
Permabulls focused on two points within the FOMC July meeting: (1) Policymakers' shift from guidance to data dependence and (2) their willingness to utter the idea that it will be appropriate to slow down hikes at some point. I have argued that the second point is meaningless and that the first point, if anything, is hawkish, releasing the Fed from the constraints of guidance.
Nevertheless, now that the Fed is overtly data dependent, I would argue that data should have a stronger impact on the bank's path to higher interest rates. Therefore, I expect that investors will be even more glued to their screens after Friday's nonfarm payrolls.
Both Powell and President Joe Biden emphasized that employment is high to negate the possibility of a recession. While Powell was more reserved, simply saying he does not think there is one, Biden was dismissive: "There is going to be a lot of chatter today on Wall Street and among pundits about whether we are in a recession. But if you look at our job market, consumer spending, business investment, we see signs of economic progress in the second quarter."
However, it is demagoguery to argue for high employment to reject the possibility of a recession when that is the last market that responds to rising rates. On the other hand, the housing market is the first to respond. And, lo and behold, the housing market is in a correction and may even crash.
Moreover, reaching conclusions from job data headlines is not analysis. What Biden didn't volunteer is that employment is unbalanced. There is a labor shortage . While employees could think it's a wonderful thing, as employers chase after them and keep sweetening their offers, it leads to recessions. Why? Here's one example: It will exacerbate the preexisting supply crisis.
Now, let's turn to the markets.
Traders raced each other to dump stocks when it finally dawned on them that the Fed wasn't backing down. They have either not been reading my posts, as I have argued since the beginning of the rally, or as some readers dismissed me as a "permabear" with fanciful theories of my being part of a cabal here to steer retail traders the wrong way. As if I have that kind of influence.
The Dow Jones Industrial Average plunged over 1,000 points or 3% on Friday. The S&P 500 Index dropped Friday by 3.37%. The Russell 2000 retreated 3.3%. However, the Nasdaq 100 underperformed, wiping out over 4%. I have been making the case that technology is the most vulnerable, as rising rates make their high valuations less appealing. In Thursday's post, I selected the S&P 500 Index instead of the Dow for Chart of the Day, even though I was more bearish on the Nasdaq 100, only because I wanted to show a top-to-bottom analysis, which will continue Monday and Tuesday. Accordingly, I will use the S&P 500 to represent stocks as a whole in this post.
As we said, the S&P 500 declined 3.37%, but its technology component plunged 4.27%, even more than the Nasdaq 100 did. Energy receded just 1.17%, followed by utilities' 1.53% retreat. Now, let's turn to the chart.
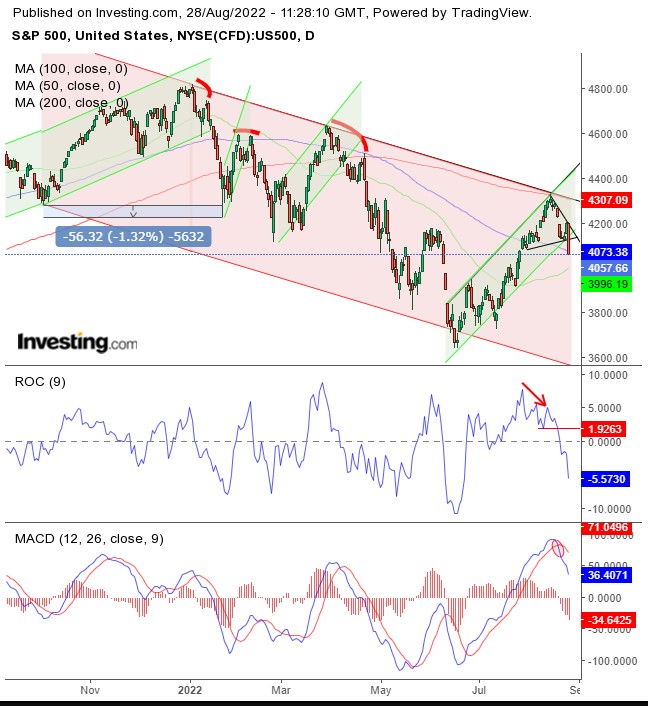
The S&P 500 Index completed a small head-and-shoulders top, precisely at the top of the long-term falling channel, which predictably outweighed the short-term rising channel. The price closed below the 100-day moving average, which, with the 200 DMA, framed the H&S. Therefore, I predict that the price will continue along the long-term falling channel. I must clarify a few misconceptions that keep resurfacing in my comments:
(1) When I say "I predict," and it doesn't happen right away, readers throw it in my face that I'm wrong and demand my response. First, don't take out one sentence while ignoring the rest of the post. Second, I didn't say I predict that the S&P 500 will make new lows when you read the post and respond to it in a week. In my posts, I expressly and repeatedly say that stocks don't move in a straight line. Just because the S&P 500 rose after I said that "I predict" it will decline doesn't necessarily mean I'm wrong. It's going up in the short term but could still fall in the medium term.
(2) I predict this is just my opinion. Nothing more. I do not, people, know the future. I have never made the claim that I do. On the contrary, I have repeatedly gone out of my way to clarify that. This is an opinion column. This is my opinion. You don't have to agree with me. It's a free country. You have the right to be wrong.
Having predicted that the S&P 500 will continue its decline, I need to clarify the following once again. In addition to not knowing that it will go down. My conclusion is based on the weight of the evidence. And I certainly do not know *when* that will happen. Again, the S&P could go up before it goes down. In fact, I expect it to. That is the say of freely traded assets when the emotional pendulum swings from one extreme to the other. It's called noise. Still, I'm not copping out, and here is my little personal research.
I have measured the S&P 500 Index's moves within this falling channel. It does not mean that it will repeat itself, but it cracks me up when readers think that when I say the S&P 500 could do what it has already done, "Don't listen to him, he's a permabear" or, "Stop making us lose money." Oh, and don't read the headline or a trade sample and then complain. Read the whole post!
The following is the gauge's data of each peak and trough within the falling channel since the January peak record, both in terms of time and price.
Date Range, number of trading sessions, overall price move, daily average price move
Jan. 24 - Feb. 24 = 23 days, 2.56% (0.11% daily)
Feb. 24 - May 2 = 4 days, 1.27% (0.32% daily)
May 2- May 12 = 8 days 5.01% (0.63% daily)
May 12 - May 20 = 6 days, 1.26% (0.21% daily)
May 20 - June 17 = 20 days, 4.55% (0.23% daily)
Time Value
from 4 to 23 days per move between peak and trough
Average 12.2 days
Median 8 days
Price Value
from 0.11% to 0.63% daily
Average 0.3% daily
Median 0.23% daily
Accordingly, the next trough should be according to the time and price values above. That is a median of eight or an average of 12 days, with a median of 0.23% or an average of 0.3% daily to the next trough. Therefore, if this trend resumes accordingly, the next trough should be roughly 10 sessions from now (splitting the difference between average and median), on Sept. 9, and about 0.265 (difference between average and median) X 10 = 2.65%. Accordingly, the next trough could be roughly on Sept. 9 at the level of 3,965.43. And how long till another low?
The following is the data on how long it took for the benchmark to fall below the previous low after each peak within the falling channel:
Jan. 4 peak record to Jan, 20 = 11 sessions
Feb. 2 to Feb. 23 = 15 sessions
March 29 to May 2 = 23 sessions
June 2 to June 13 = 7 sessions
According to this, the S&P 500 should break the June low by most in 23 sessions since its Aug. 16 peak, leaving it up to 15 sessions. However, one more consideration: The June low is the first time the price touched the channel bottom, as it is structured. Perhaps that long decline will take longer. Let's then see how long it took the price to fall below the low the first time the gauge touched the channel bottom.
Oct. 4 (trough) - Jan. 24 (trough) = 77 trading days. The price difference between these troughs was 56.32 points or 1.32%.
Dollar bulls remained in charge as central banks tightened amid a broad recession expressed via poor preliminary PMI readings and the European energy crisis.
Accordingly, a would-be H&S top's breakout became a bear trap. Still, the price found resistance Thursday at the right shoulder's height. The dollar will gain upward momentum if the price blows out the H&S.
Rising rates have been pushing gold lower since it neared its August 2020 peak in March. The Fed's aggressiveness outweighed the worst inflation in four decades. Yet, some equity bulls just don't get the picture. If the price falls below $1,670, it will have completed a massive double top, aiming at $1,270.
The Fed's wakeup call led to another Bitcoin selloff, falling below the purist trendline, having already completed my interpretation of a rising wedge.
Crude Oil WTI Futures prices rose on signals that OPEC might cut output, causing the S&P 500's energy sector to outperform with a 1.17% slide. However, from a technical perspective, I expect oil to keep falling. Here is my earlier analysis. And here's an update: Oil may be about to complete its third consecutive continuation pattern after topping out, after confirming the 200 DMA's reversal from support to resistance.
Trading in financial instruments and/or cryptocurrencies involves high risks including the risk of losing some, or all, of your investment amount, and may not be suitable for all investors. Prices of cryptocurrencies are extremely volatile and may be affected by external factors such as financial, regulatory or political events. Trading on margin increases the financial risks.
Before deciding to trade in financial instrument or cryptocurrencies you should be fully informed of the risks and costs associated with trading the financial markets, carefully consider your investment objectives, level of experience, and risk appetite, and seek professional advice where needed.
Fusion Media would like to remind you that the data contained in this website is not necessarily real-time nor accurate. The data and prices on the website are not necessarily provided by any market or exchange, but may be provided by market makers, and so prices may not be accurate and may differ from the actual price at any given market, meaning prices are indicative and not appropriate for trading purposes. Fusion Media and any provider of the data contained in this website will not accept liability for any loss or damage as a result of your trading, or your reliance on the information contained within this website.
It is prohibited to use, store, reproduce, display, modify, transmit or distribute the data contained in this website without the explicit prior written permission of Fusion Media and/or the data provider. All intellectual property rights are reserved by the providers and/or the exchange providing the data contained in this website.
Fusion Media may be compensated by the advertisers that appear on the website, based on your interaction with the advertisements or advertisers.