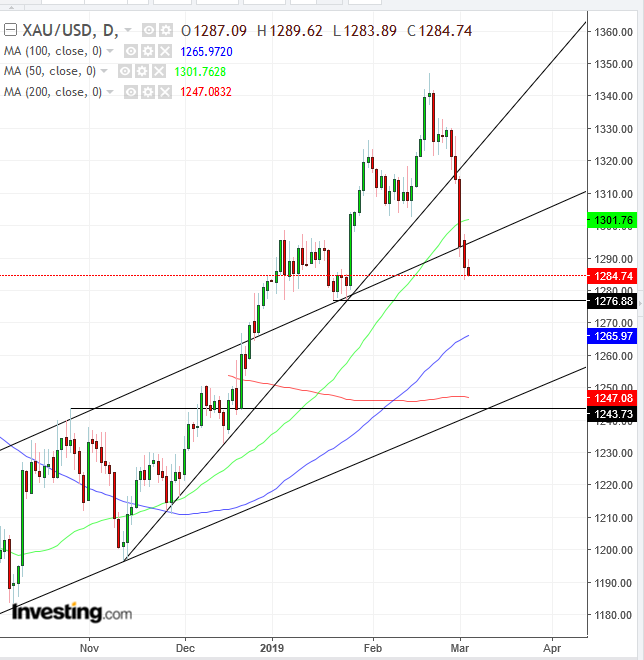
The price of gold is falling for the seventh consecutive day today, down 0.2% to $1285.55 at time of writing, having retreated 3.5% since the Feb. 25 close. As the best-known safe haven asset, the precious metal's fortunes are often dictated by investor fear of market risk.
More specifically still, it generally trades in counterpoint to the strengthening dollar, which has been rising for almost the same number of sessions gold has been falling. However, we think this is a short-term sell-off, a correction that provides investors with a buying opportunity.
The U.S. currency has so far been defying President Donald Trump’s attempt to renew his “dollar too strong” rhetoric, which started the greenback’s downfall in January 2017. Gold's clear correlation to the trajectory of the dollar means that if this were to change, it could influence the direction of the yellow metal too.
In addition, although Australia produced a record 317 tons of gold in 2018, beating its 1997 peak of 314.50 tons, analysts expect global gold production to have declined in 2018 for the second consecutive year. Therefore, before rushing to chase the short-term downtrend, we’d encourage investors to pay attention to the medium-term trend, which is up.

After accelerating its rise in December from the August bottom and reaching multiple upward targets we provided in a series of posts since December 2017, the precious metal corrected, as bulls cashed out and let in new blood, which carried the load higher.
Ideally, the price could return to the bottom of the rising channel developed since the Aug. 15 bottom—reinforced by the 200 DMA—but it may not. It might rebound off the January lows or the December congestion. While we can’t know when and where it will rebound, we are satisfied with the near -5% drop, after locking in 12.5% since the November trough, from where the advance became steeper.
Now, traders have to patiently wait to find evidence of demand, which would hopefully be in the form of a consolidation, as bulls come back for another rally, allowing traders to calmly return. If prices sharply rebound, traders may find themselves chasing prices up, a less than ideal entry, as it becomes difficult to determine whether prices will continue to rise or may fall back down.
Trading Strategies
Conservative traders should wait for a full correction toward the channel bottom, supported by the 200 DMA, with evidence of consolidation.
Moderate traders might enter if they see consolidation above the 100 DMA, currently just below $1,266.
Aggressive traders may risk a long position with at least one long, green candle, bouncing off the $1,276 level, the late-January lows, which found support above the channel top.
Trade Sample
- Entry: $1,281, above the psychological round number
- Stop-Loss: $$1,276, below January lows
- Risk: $5
- Target: $1,296, below the psychological round number and January highs
- Reward: $15
- Risk-Reward Ratio: 1:3
