The Australian share market closed out July with a whimper. The benchmark ASX200 eked out a 0.09% gain after a topsy turvy session which saw it give up early gains but recover from late-session losses.
The index closed July at 7,410 points, 2.8% better than the 7,203 it ended at on June 30. July's performance is the best since January and pushes the ASX200 closer to its all-time high set nearly two-years ago at 7,633 on 13 August 2021.
Most investors in Australian shares would consider the local bourse has underperformed their surging US counterparts. Certainly, the benchmark S&P500 is on track to deliver a similar 2.9% gain in July but is up 19% in 2023 compared to the ASX200's paltry 5.3% gain.
The Aussie share market can claim one modest win over US shares, however. When we look at how the two markets have performed on a total return basis, the little Aussie battler comes out ahead.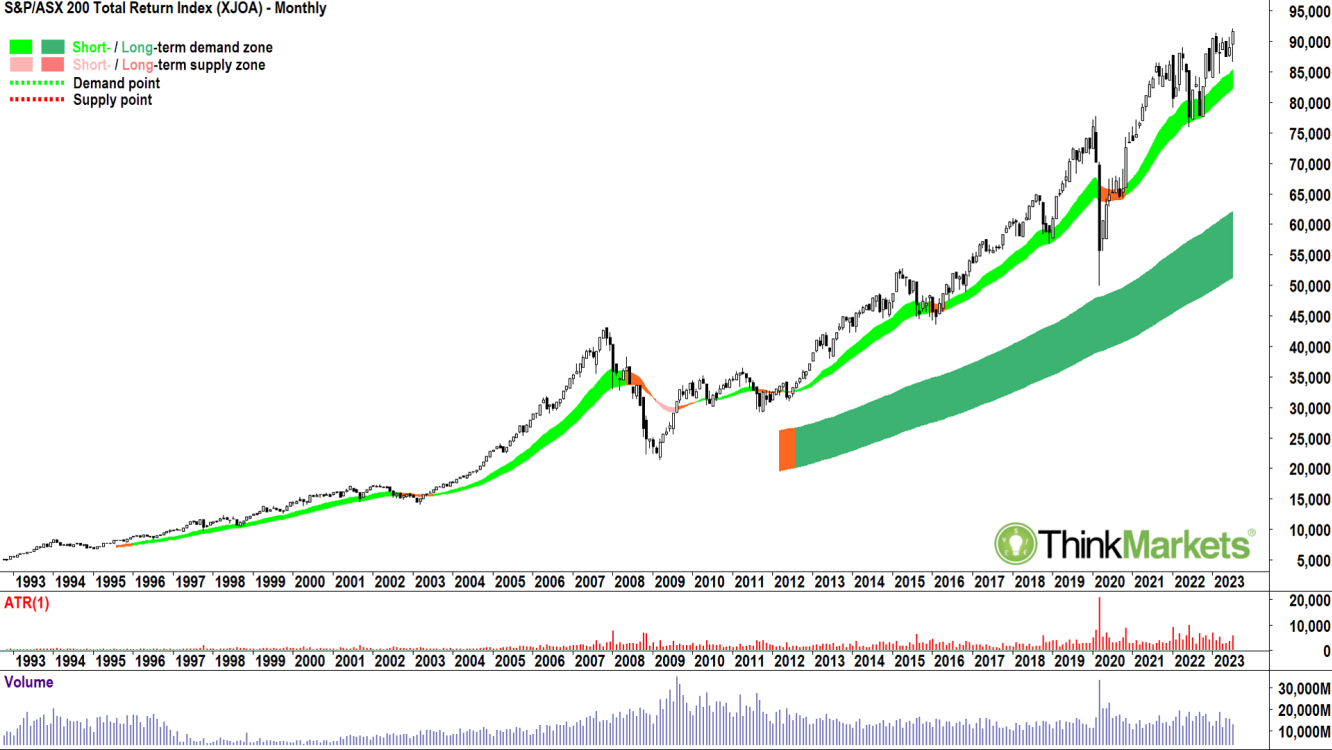
Total return indices consider all returns to a shareholder, that is, both price appreciation and dividends and capital returns. They are a better representation of what a buy and hold investor might experience. The Austalian share market, as measured by the ASX200 Total Return index has closed out July at its highest ever end of month level.
Granted, the S&P500 Total Return index isn't far behind its own end of month record closing high. The chart below shows it's now just another 1.45% away from achieving this. But for now, the Australian share market maintains the honor (despite only a 7.7% gain so far in 2023 once dividend returns are considered).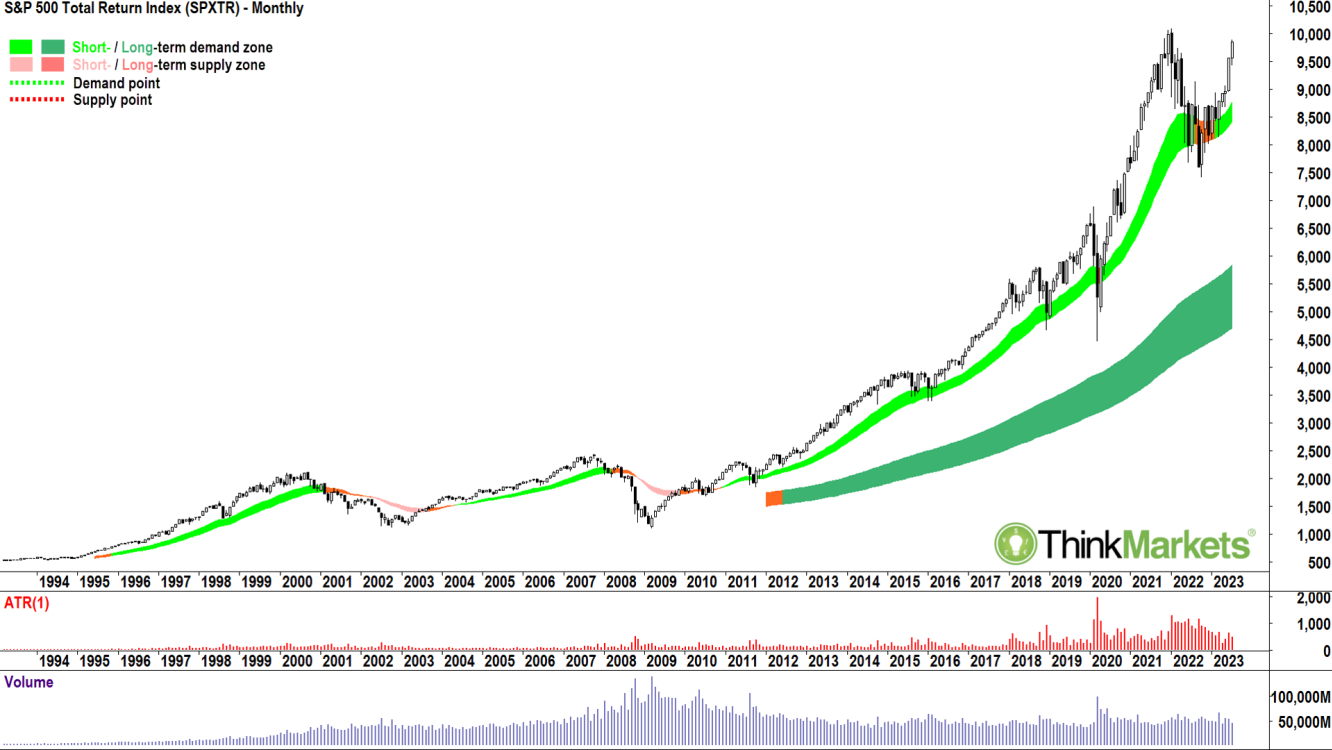
For those who chop and change in and out of trades, you might find your portfolio doesn't represent either chart, particularly if you panicked out during the COVID-19 bear market. Or if you've doubted the market's ability to withstand the sharpest and largest interest rises in living memory. These charts do show the benefits of staying the course as an investor.
Today's Focus Stocks
Interesting ASX companies which caught my eye today…
1. Acrow Formwork & Construction Services (ASX: ACW)
ACF provides a range of scaffolding hire services across Australia as well as bespoke engineered formwork for building construction and infrastructure projects. Products include specialist screening systems for the construction industry, formwork and scaffolding solutions, equipment and services, supported by in-house engineering and labour supply.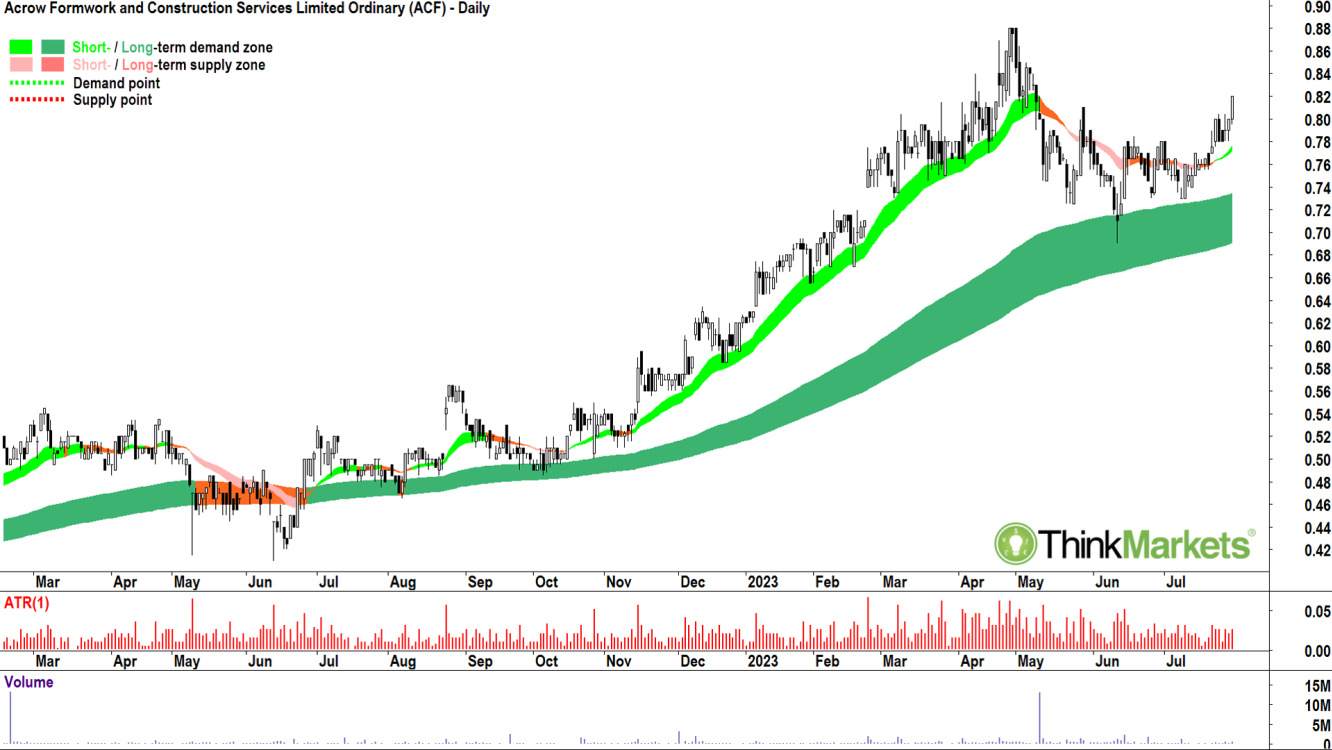
The ACF chart shows a newly established short-term trend and a well-established long-term trend. The price action has returned to higher peaks and higher troughs after a period of consolidation since the April all-time high. Candles since the 11 July low are predominantly white. The combination of these factors suggests there is healthy excess demand for ACF shares.
Analyst view: I am comfortable adding risk to ACF around the current price and while the short-term trend remains up.
2. Lend Lease Group (ASX: LLC)
LLC is a property and investment company which specialises in property construction and development. It develops and manages a range of residential, office, retail, industrial, and retirement properties, as well as several major infrastructure assets. The Company's has extensive operations across Australia, as well as major operations in the United States, Europe, and Asia.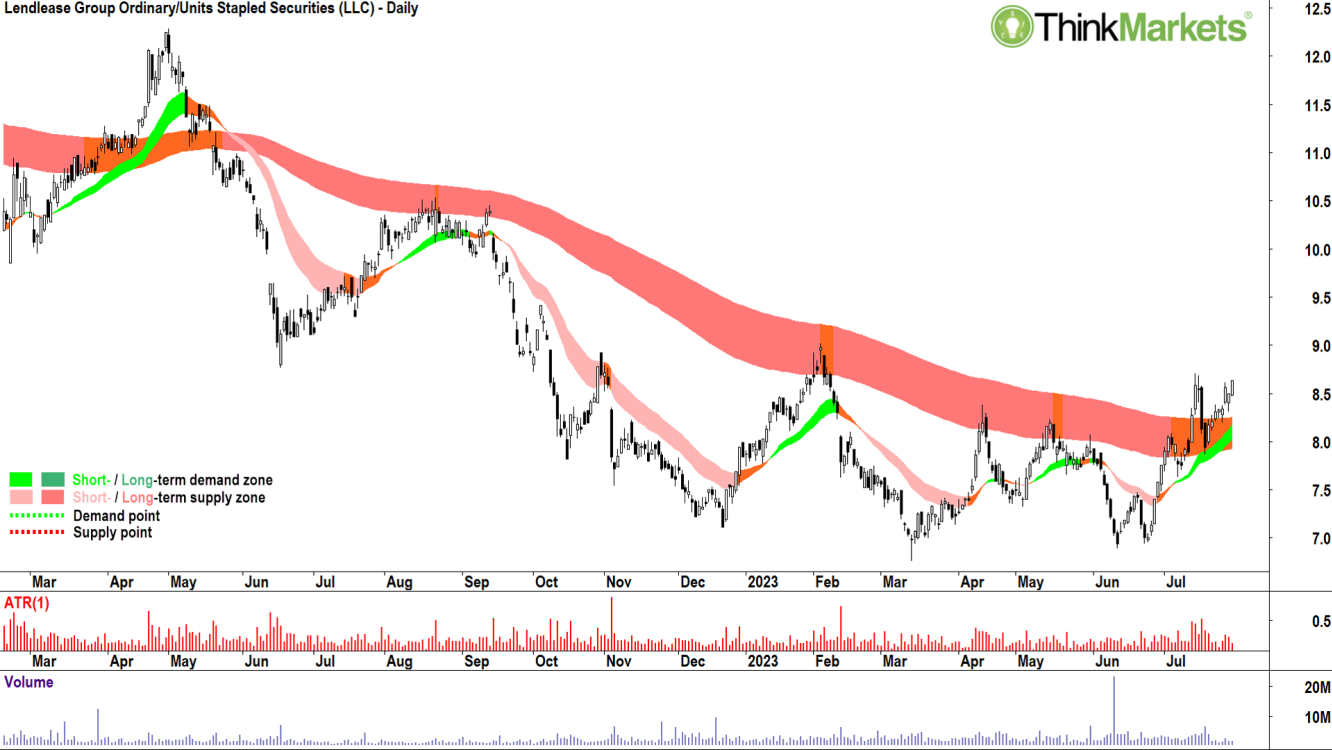
The LLC chart shows a well-established short-term trend and a neutral long-term trend. The price action has returned to higher peaks and higher troughs after a major price correction since November 2021. Candles since the 26 June low are predominantly white. A key indicator of long-term trend transition (i.e., back to up) is the break above the long-term trend ribbon (amber zone) followed by a retest and hold of the ribbon. Observe how the ribbon was instrumental in resisting price appreciation throughout the downtrend, yet now is offering dynamic support. The combination of these factors suggests there is healthy excess demand for ACF shares in the short-to-medium term.
Analyst view: I am comfortable adding risk to LLC around the current price and while the short-term trend remains up.
3. Seven Group Holdings (ASX: SVW)
SVW is a diversified industrial company with operating segments in equipment hire, energy and media. Its segments include WesTrac, Coates, Energy, and a major interests in media group Seven West Media and building materials company Boral. WesTrac and Coates provide equipment to the mining, engineering, construction, and asset maintenance sectors.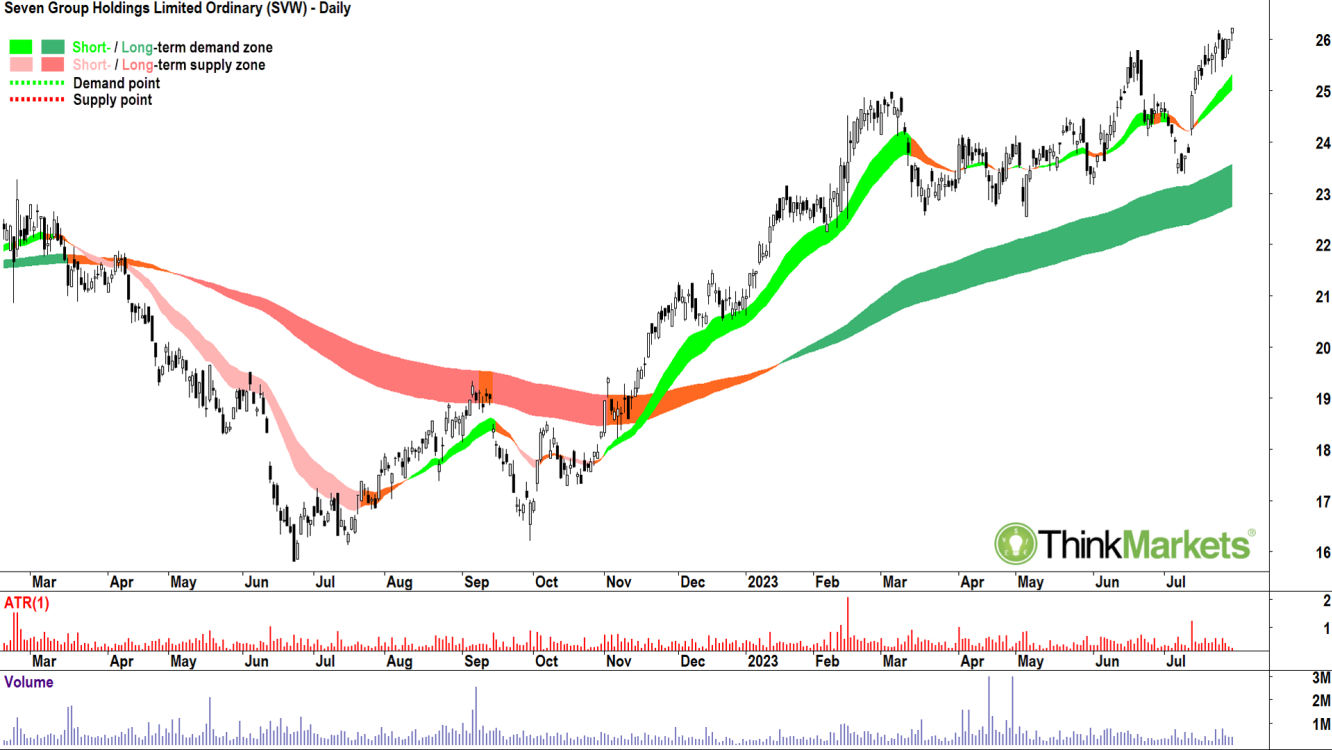
The SVW chart shows a well-established short-term trend and a well-established long-term trend. The price action has returned to higher peaks and higher troughs after a period of consolidation since the June all-time high. Candles since the 11 July low are predominantly white. The combination of these factors suggests there is healthy excess demand for SVW shares.
Analyst view: I am comfortable adding risk to SVW around the current price and while the short-term trend remains up.
4. XRF Scientific (ASX: XRF)
XRF’s technology is used to measure the composition and purity of materials and is mainly applied in industrial quality control and in process control for manufacturing processes in industries such as metals and mining, construction materials, chemicals and petrochemicals. The company's main segments include precious metals, equipment, and consumables.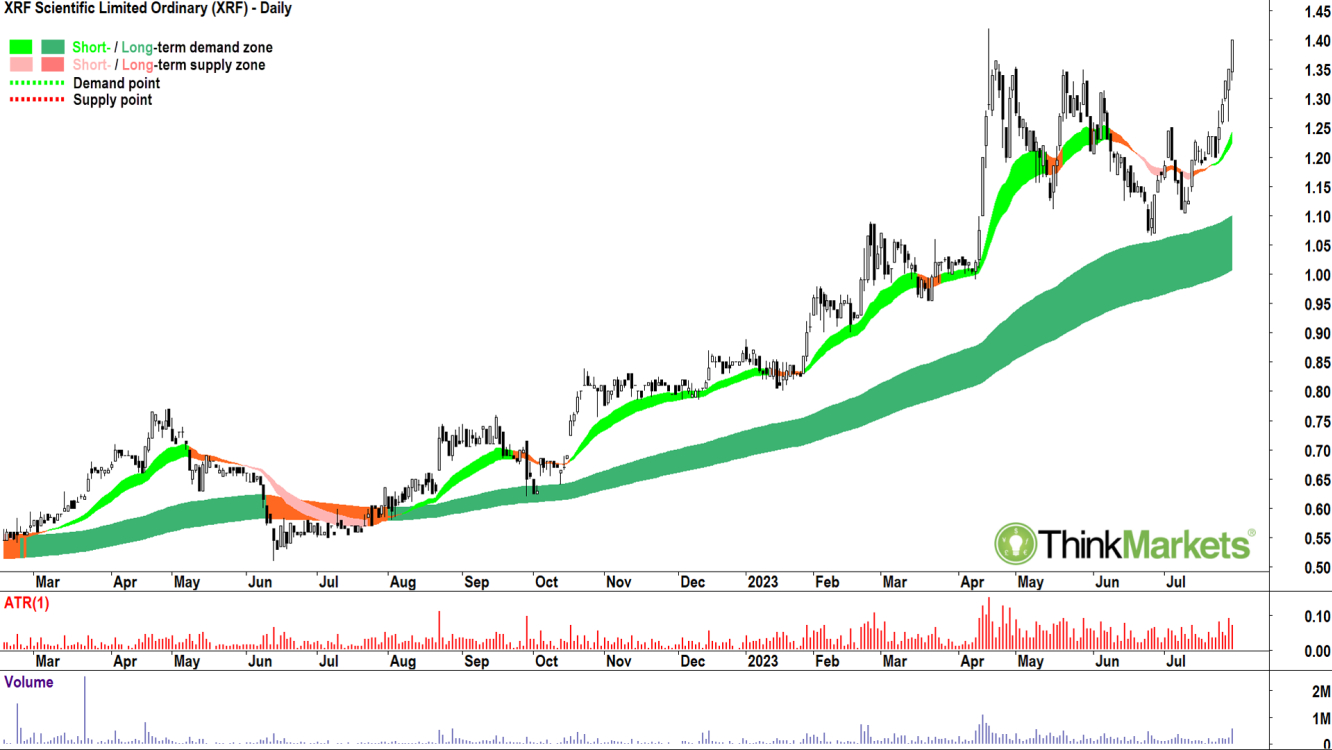
The ACF chart shows a newly established short-term trend and a well-established long-term trend. The price action has returned to higher peaks and higher troughs after a period of consolidation since the April all-time high. Candles since the 11 July low are predominantly white. The combination of these factors suggests there is healthy excess demand for XRF shares.
Analyst view: I am comfortable adding risk to XRF around the current price
and while the short-term trend remains up.
Want More!?
Follow me on Twitter: @CarlCapolingua or read more of my articles at: https://www.thinkmarkets.com/au/market-news/
About ThinkMarkets
Established in 2010, ThinkMarkets is a multi-awarded provider of online trading services. We are fully committed to making trading accessible to everyone, highlighting great importance on trading education and financial literacy. Go to: https://www.thinkmarkets.com for more information.
