In its November Market Insight, State Street (NYSE:STT) Global Advisors explains how Australian company earnings have diverged from global markets in 2023.
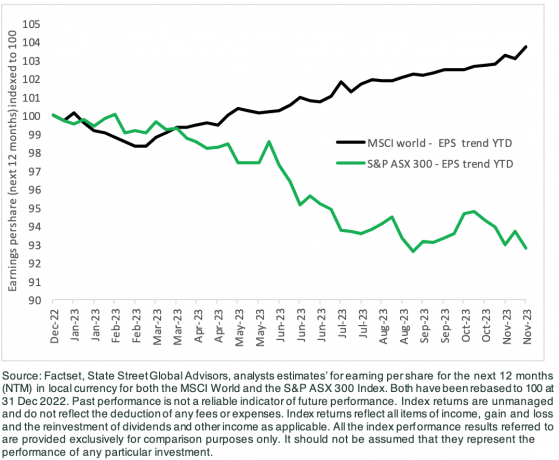
In 2023, the Australian market has seen earnings downgrades of -7.2%, heavily influenced by the top 10 index weights. Downgrades in financial and material stocks have had a large impact on the overall Index due to the highly concentrated nature of the benchmark.
In contrast, the MSCI World Index (MSCI World) has seen small upward earnings revisions of +3.7% in 2023 also driven by the top 10 mega cap names.
While much has been written about the concentrated nature of the MSCI World, less has been said about the even more concentrated Australian market driving these outcomes.
Earnings per share MSCI World and S&P ASX 300:
Of the S&P ASX 300 Index, top 10 names in Australia make up 46%. However, the top 10 in the MSCI World only account for 21% of the market.
On this measure the Australian benchmark is more than twice as concentrated than the MSCI World. Moreover, this comes at a time when the MSCI World is more concentrated than it has been for at least the last three decades.
The extent of the Australian concentration is further exacerbated by the lack of sector diversification across the 10 largest securities.
Financials and Materials dominate the top index weights in the ASX 300. This means that when Financials and Materials are doing well, and the index also does well. But equally, when they face headwinds so too does the broader Index.
Market concentration comparison Australian Vs MSCI World Index
Here is a breakdown of the top 10 names for the S&P ASX 300 Index and for the MSCI World Index:
In contrast, US mega caps have seen significantly positive earnings revision especially in Technology, Communication Services and Consumer Discretionary. The dominance of the mega caps has hidden many of the more negative trends across the rest of the index.
The theme of negative earnings per share (EPS) trends in the year to date for Financials, Materials and Energy have been consistent in both Australia and other developed markets.
The bottom line
The ASX has seen negative earnings trend in 2023 — the majority is attributed to the concentrated weight in the domestic Banks and the Materials sector which have seen negative revisions this year.
State Street concludes that this highlights why a diversified, active and benchmark unaware approach has more relevance in the forward environment in Australia. In contrast, returns from the MSCI World have benefitted from concentration in the mega cap Technology and Discretionary sectors.
As such, regardless of your geographic equity preferences, in an environment where the risks are rising it’s important to have a bias to quality and a decent exposure to defensive sectors, which are more resilient in volatile equity markets as we approach 2024.