
A reversal of the UK’s recent economic “plan” plus strong earnings on Wall Street saw stocks on both sides of the Atlantic surge overnight, with the USD falling against most currencies except Yen as a result of the risk on mood. US bond markets rallied, taking their lead from the reversal in UK gilts after the backflipping of Truss’s ridiculously bad tax cuts, which meant 10 year Treasury yields down to the 3.9% level before easing off to finish right on 4% at the close. Meanwhile commodities were mixed, with oil prices still hovering around their recent lows as Brent crude remained below the $92USD per barrel level while gold is still under pressure despite more positive moves in other undollars, currently trading at the $1650USD per ounce level.
Looking at share markets in Asia from yesterday’s session where mainland Chinese share markets were the best relative performers with the Shanghai Composite down slightly at first before a late rally saw it close 0.4% higher to hold above the 3000 point barrier while the Hang Seng Index tried to get out of sell mode, down 1% at one stage before finishing in the green, up 0.1% to 16612 points. The daily futures chart however is still showing a deep bear market in place, although there is some price deceleration evident here around the 16500 point mid level. As I said last week following the failure of the recent dead cat bounce, the subsequent break below the 17000 point level is likely to accelerate the selloff, but that could change if any price action breaks above the high moving average:

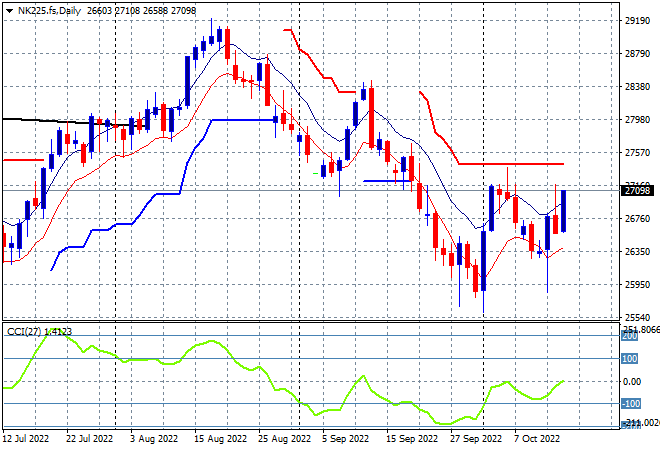
Japanese stock markets also moved lower, with the Nikkei 225 closing down 1.1% to 26775 points. The daily price chart shows a possible breakout brewing here under overhead resistance at the 27500 level in this second bounce of the dead cat that may actually prove more lively. Futures are indicating a better start for today’s session given the big bounce on Wall Street although daily momentum remains negative:
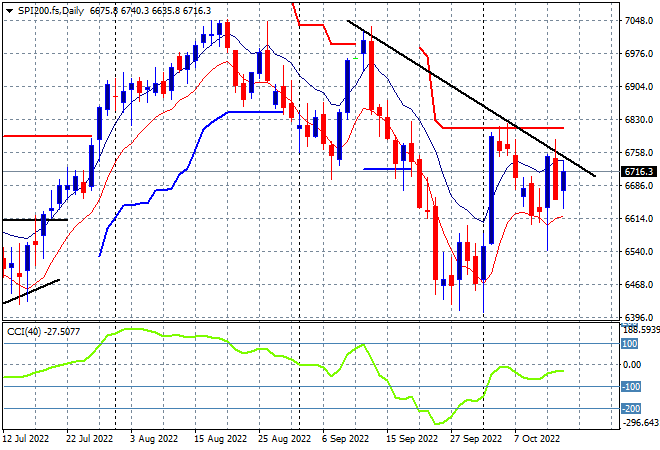
Australian stocks were unable to escape the selling, with the ASX200 starting the trading week well below the 6700 point level, down more than 1.4% at 6664 points. SPI futures however are up nearly 1% in the wake of the bounceback on Wall Street overnight. The daily chart shows the lack of potential as price action just can’t push above trailing ATR resistance at the 6800 point level or the downtrend line as daily momentum remains negative – but there is some reason to be slightly positive here:
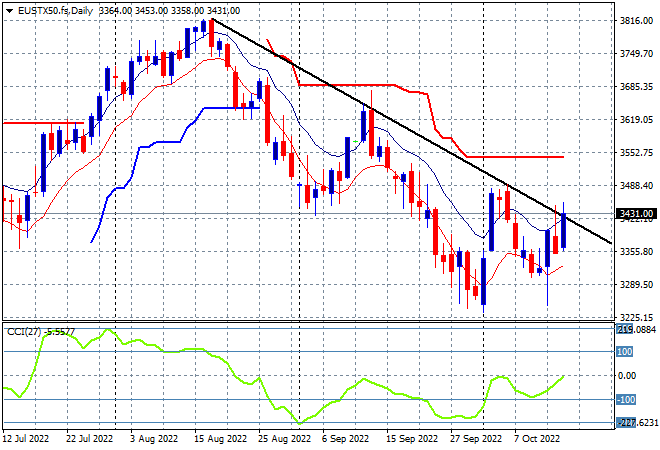
European stocks had a solid start to the trading week with solid returns across the continent, as the Eurostoxx 50 Index closed 1.7% higher at 3441 points. The daily chart is showing similar price action that is trying to bounce off the recent lows above the 3200 point level but resistance at the 3550 level remains ominous overhead. The downtrend from the August highs remains intact despite the test overnight, with daily momentum trying to get back into the neutral zone. Cautiously optimistic here that something is brewing:
Wall Street however pushed even higher with tech stocks leading the way, with the NASDAQ up more than 3% while the S&P500 took back almost all of its previous session losses to close 2.6% higher at 3677 points. The four hourly chart shows the classic dead cat bounce following a bear trap pattern has not come to pass with strong support at the 3600 point level helping. Price action is now back to the previous Friday’s high, yet no higher, which could be brewing an upside breakout:

Currency markets finally lifted against the ever strong King Dollar, helped by the movements in bond markets overnight with Euro surging through the 98 handle. The union currency had been under a lot of pressure, unable to climb back above that level all last week but finally cleared overhead resistance with short term momentum now back to overbought status. This could be a one off move higher however, so I’m watching for a subsequent move above the 98.50 mid level before getting excited.

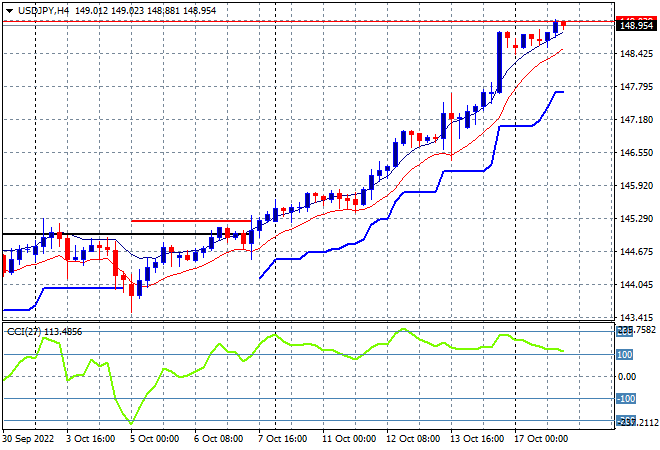
The USDJPY pair continued to push higher and higher, nearly breaking through the 149 handle in a one way trip despite no correlation with other undollar currencies, let alone domestic stock markets. Short term momentum has remained in overbought mode since last Friday with the USD just too strong despite the usual firm correlation with the defensive Yen. Watch for a potential pullback as this has gotten way out of hand although nominal technical readings are not yet extreme, price action has gone too far too fast:
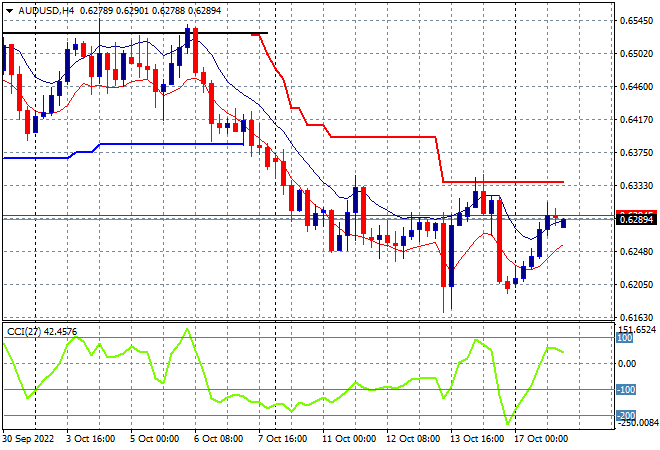
The Australian dollar continues to have a wild ride, and after breaking back down to the 62 handle last night saw it zoom back to the previous highs but still falling short of the 63 level. This still shows a lot of internal weakness, with commodity price correlation not helping here either. Resistance is just too strong at all the previous levels with the 65 handle now the area to beat in the medium term. Short term momentum is back to a neutral setting but nothing excitable just yet with price action looking weak with a failure to really boost above the high moving average on the four hourly chart:
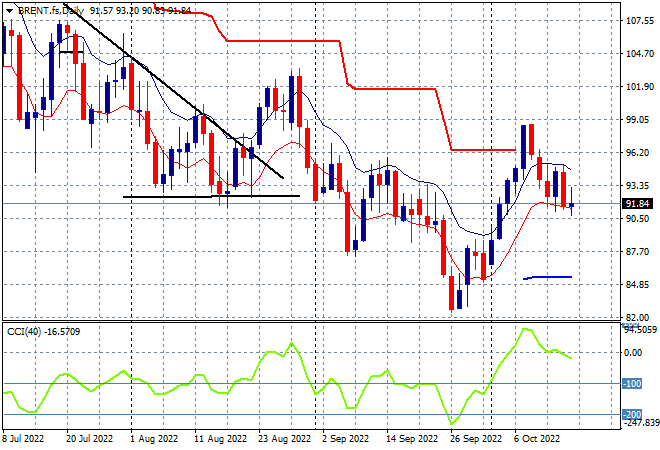
Oil markets were again unable to gain traction with a choppy session keeping Brent crude down at a new weekly low, just below the $92USD per barrel level. While daily momentum has switched to a more positive setting than before, it never got overbought with price action unable to get back above the high moving average in recent sessions, so I continue to watch short term resistance at the $96 level on the daily chart for any breakout signs:
Gold had similar intrasession volatility to other undollar currencies but couldn’t hold to any gains, reverting back to the $1650USD per ounce level and near its recent new weekly low at the $1643 level. This continues to show how weak internally the shiny metal really is, unable to clear easy resistance levels, and brings back into focus the multi-monthly bearish setup and ends the early stages of a bottoming action, instead setting up another leg down:
